This document provides basic steps to create and edit a service operations view. This guide is not applicable for Kubernetes data sources, as in those cases services are automatically discovered. See the QuickStart Guide for a walkthrough tutorial with Kubernetes as data source.
Launch the Editore
Log into RealOpInsight as administrator and select the menu Editor to load the user interface.
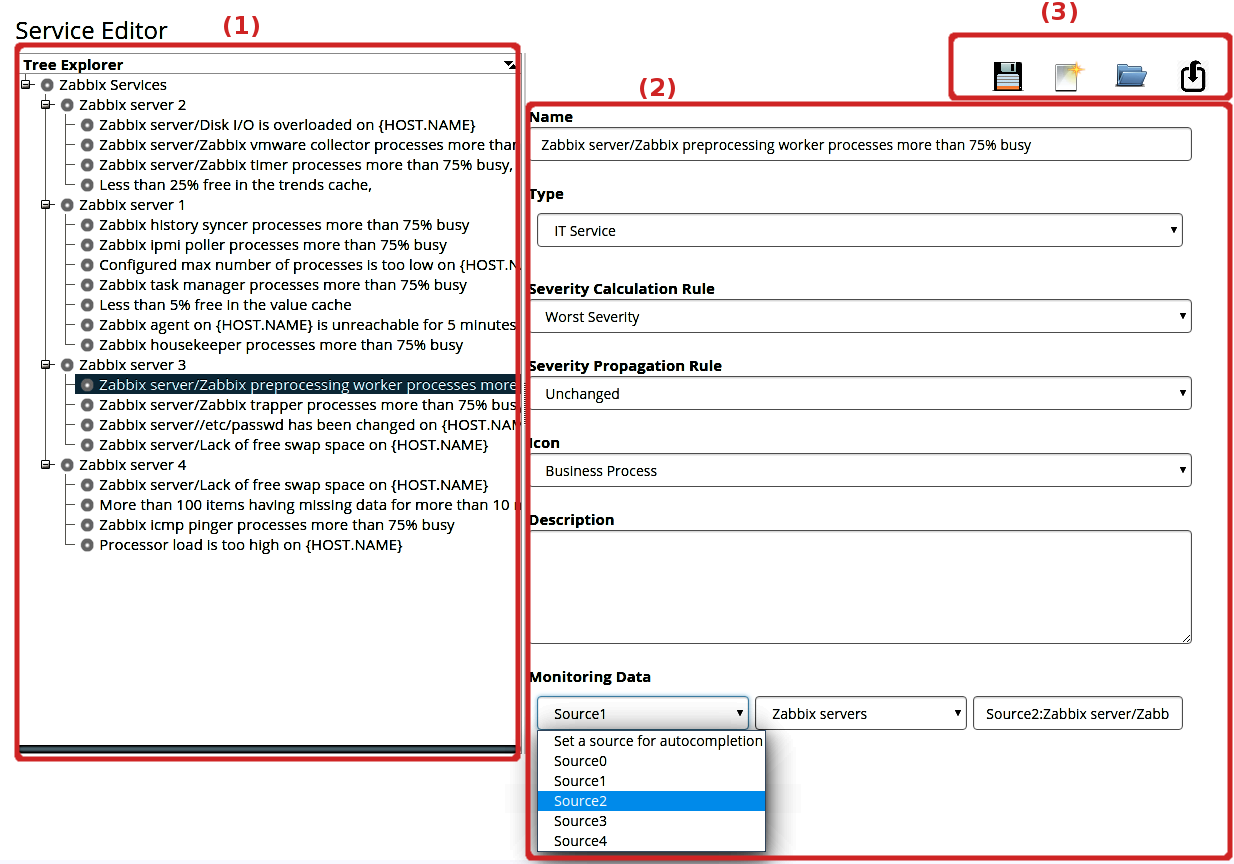
As depicted on the screenshot below the user interface consists of the following:
- A Tree Explorer (1) that shows the service tree. It’s an active component that enables features to ease the organization of service dependencies.
- A Edition Pane (2) where the properties of services are edited. When a service is selected in the Tree Explorer, its properties are automatically filled in the edition pane. Any changes made on the edition fields is automatically applied to the selected service.
- A Menu area (3) that enables access to various other features descrived in next sections.
Menus & Shortcuts
Available edition menus and their keyboard shortcuts are the following:
- Create a new service view (
Shift + N) - Open an existing service view (
Shift + O) - Save current changes (
Shift + S) - Auto discovery monitoring items (
Shift + I) - Add sub service to a selected service node (
Shift + C) - Remove a selected service node (
Shift + D, Be careful as no confirmation is asked).
Menu shortcuts are enabled only when the mouse focus is on the Tree Explorer.
Edit A Service Tree
Assume that you’ve open a new or an existing service view, the edition of service tree work as follows:
- When a node is selected from the Tree Explorer, the edition pane is automatically filled in with the properties of the associated service.
- You can doubleclick on a tree node to enable its context menus (e.g. context menus to add sub a sub-service or to remove it). You can also use menu shortcuts instead.
- When a tree node is selected and that the
Add sub servicemenu is triggered, the following happens:- A new service is created and added as child of the selected service in the Tree Explorer;
- The newly created service is automatically selected;
- The edition pane is filled in with the properties of the newly created service.
- You can fulfil the properties of the new service as explained here: Section Service Properties<service_properties>.
- When a tree node is selected and that the
Remove servicemenu is triggered, the service and all its descendants are destroyed. Please note that no confirmation is asked. - You can add many sub-services as you want under a
Business Servicenode. It’s worth to mention that adding sub-services underIT ServiceorExternal Servicenode is forbidden. - Your changes can be saved at any time by clicking on the appropriated button, or by triggering its keyboard shortcut (
Shift + S)
Service Properties
Each service is defined by the following properties:
- Name
Serves as label for the service.
- Type
Possible values are
IT serviceorBusiness Process(default), according to the position of the service in the tree.- Status Calculation Rule
Defines how the status of the service is computed according to the severities propagated by its subservices. Read Severity Calculation and Propagation for more details.
- Status Propagation Rule
Defines how the severity of the service will be propagated to its parent service. Read Severity Calculation and Propagation for more details.
- Weight
Sets a
weight factorthat tells how important the service is to its parent service, i.e. compared to other sibling services. The default weight is 1 (basic weight). Read Severity Calculation and Propagation for more details.- Icon
Sets an icon to associate to the service on the Service Operations Console.
- Description
Optional, this field allows to define more information about the service.
- Data Point
Specific to IT services, this sets the monitoring item to associate to the service (i.e. Nagios check, Zabbix trigger, Zenoss component, OpManager service…). See details later in this document.
Pattern of Data Points Definition
By convention, a valid definition of data point must match the following pattern SourceId:Host/MonitoringItem:
SourceIdsets he identifier of a valid monitoring source<settings-ultimate>.Hostmust match a host or a device monitored by your backed monitoring system.MonitoringItemmust match a monitoring item associated to the host named Host, i.e. a Nagios check, a Zabbix trigger, a Zenoss component, a Padora FMS module or an OpManager monitor.
Examples
- For Nagios and similar monitoring systems, data point must have the following structure: ‘SourceId:host_name/service_description’. E.g. The following identifies the check allowing to monitor the CPU load on the server named mysql-server on Nagios server associated to Source1 ‘Source1:mysql-server/Current Load’.
- For Zabbix, a data point must have the following structure: ‘SourceId:host_name/trigger_name’. E.g. The following corresponds the trigger allowing to monitor the swap space on the Zabbix server set to Source0: Source0:Zabbix server/Lack of free swap space on{HOST.NAME}.
- For Zenoss, a data points must have the following form ‘SourceId:device_name/component_name’. E.g. The following data point identifies the component responsibles for monitoring the Apache server process (httpd) on the Zenoss Server set to Source2: ‘Source2:locahost/httpd’
- For Pandora FMS, a data point must have the following form
SourceId:agent_name/module_name. E.g. the following data point defines the module responsibles for monitoring the CPU load on the Pandora server set to Source3:Source3:locahost/CPU Load
Easy Selection of Data Points by Autocompletion
To ease the setting of data points when editing service view so as to to avoid typo errors, the Web Editor provides the ability to automatically retrieve monitoring items from your backed monitoring servers and organize them as data points. Using this feature, the user can import and set data points in a few clicks.
This feature is automatically enabled for any configured monitoring sources.