This guide is a walkthrough to integrate RealOpInsight with a Kubernetes source.
The installation will be based on the latest Docker distribution. For other installation options, i.e. using binary packages or a virtual machine image, please read the Installation Guide.
At the end of this guide you will see how RealOpInsight provides easy yet powerful alternative Kubernetes dashboards for service operations monitoring.
Requirements
The below steps assume that:
- You followed the Getting Started Guide to set up an instance of RealOpInsight.
- You have a Kubernetes cluster or Minikube setup and ready to use.
- If RealOpInsight is installed outside the target Kubernetes cluster, ensure that the cluster API is reachable from the instance.
Integrate Kubernetes as a Probe Source
Proceed as follows in order to integrate Kubernetes as a monitoring data source:
- Log into RealOpInsight UI as administrator (default credentials:
admin/password). - Select the menu
Monitoring Sourcesto fill in the monitoring source settings. - Set the source
TypetoKubernetes. - Set the field
Monitor API Base URLto the API endpoint of your Kubernetes instances. If you’re using a proxied access to Kubernetes API, set it to the proxy endpoint (e.g.http://127.0.0.1:8001/). - (Optional) Set
Auth Stringwith the token to use to connect to Kubernetes. You would typically leave this field empty if you’re using a proxied API access or if RealOpInsight is deployed as pod using its official Helm chart. - Leave the other fields as is and click
Add as source. - When prompted, select a
Source IDand cickOK. - A status confirmation message shall be displayed upon the source is add.
For this quickstart guide a single source is enough, but you can repeat the above steps to add as many monitoring sources as you want to integrate with RealOpInsight.
Introducing Kubernetes Namespace Application Dashboard

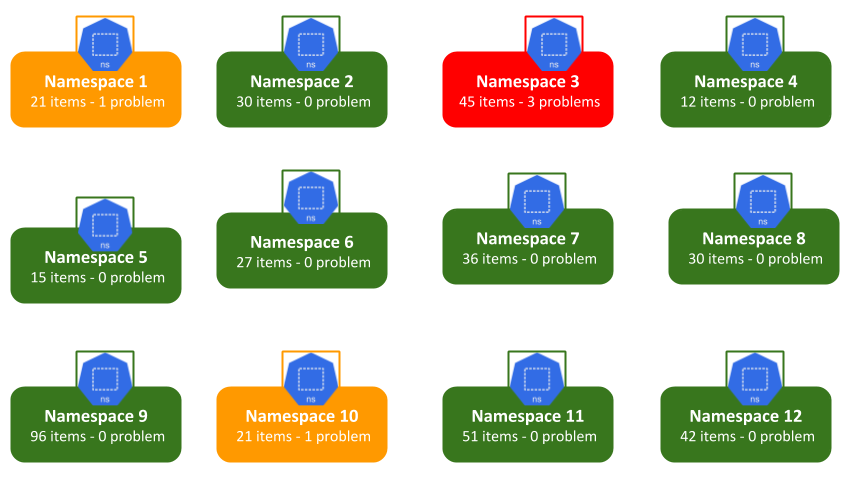
After a successful configuration of a Kubernetes source, RealOpInsight automatically discovers all services in Kubernetes and grouped them by namespace in what is called Namespace Application Dashboard. A Namespace Application Dashboard is defined by the set of all services belonging to a given namespace in Kubernetes. It’s organized as a dependency graph where each service is bound to its related pods, which each is in turn bound to the containers that compose it. See an illustration on the figure hereafter.
By this way RealOpInsight provides a high level, yet comprehensive view on services within each namespace. Ultimately, RealOpInsight allows you to build dashboards consisting in one or more namespace views, which you can assign to your operations teams in an effective and intelligent way, in regard of your internal operational processes and policies.
Namespace Application Dashboard
As administrator you can preview and check the Application Dashboard for any single operation view before assigning it for operations.
- Log into RealOpInsight as administrator.
- Select the menu
Operations Profilesto see the list of managed views, it shall contain entries related to the namespaces you have in Kubernetes sources you already configured. Each entry is prefixed with the Id of the monitoring source (e.g. Source0:kube-system for namespace kube-system in Source0. - Select the menu
Preview. - Select an entry in the list of managed views (e.g. select Source0:kube-system for this tutorial).
- Click on
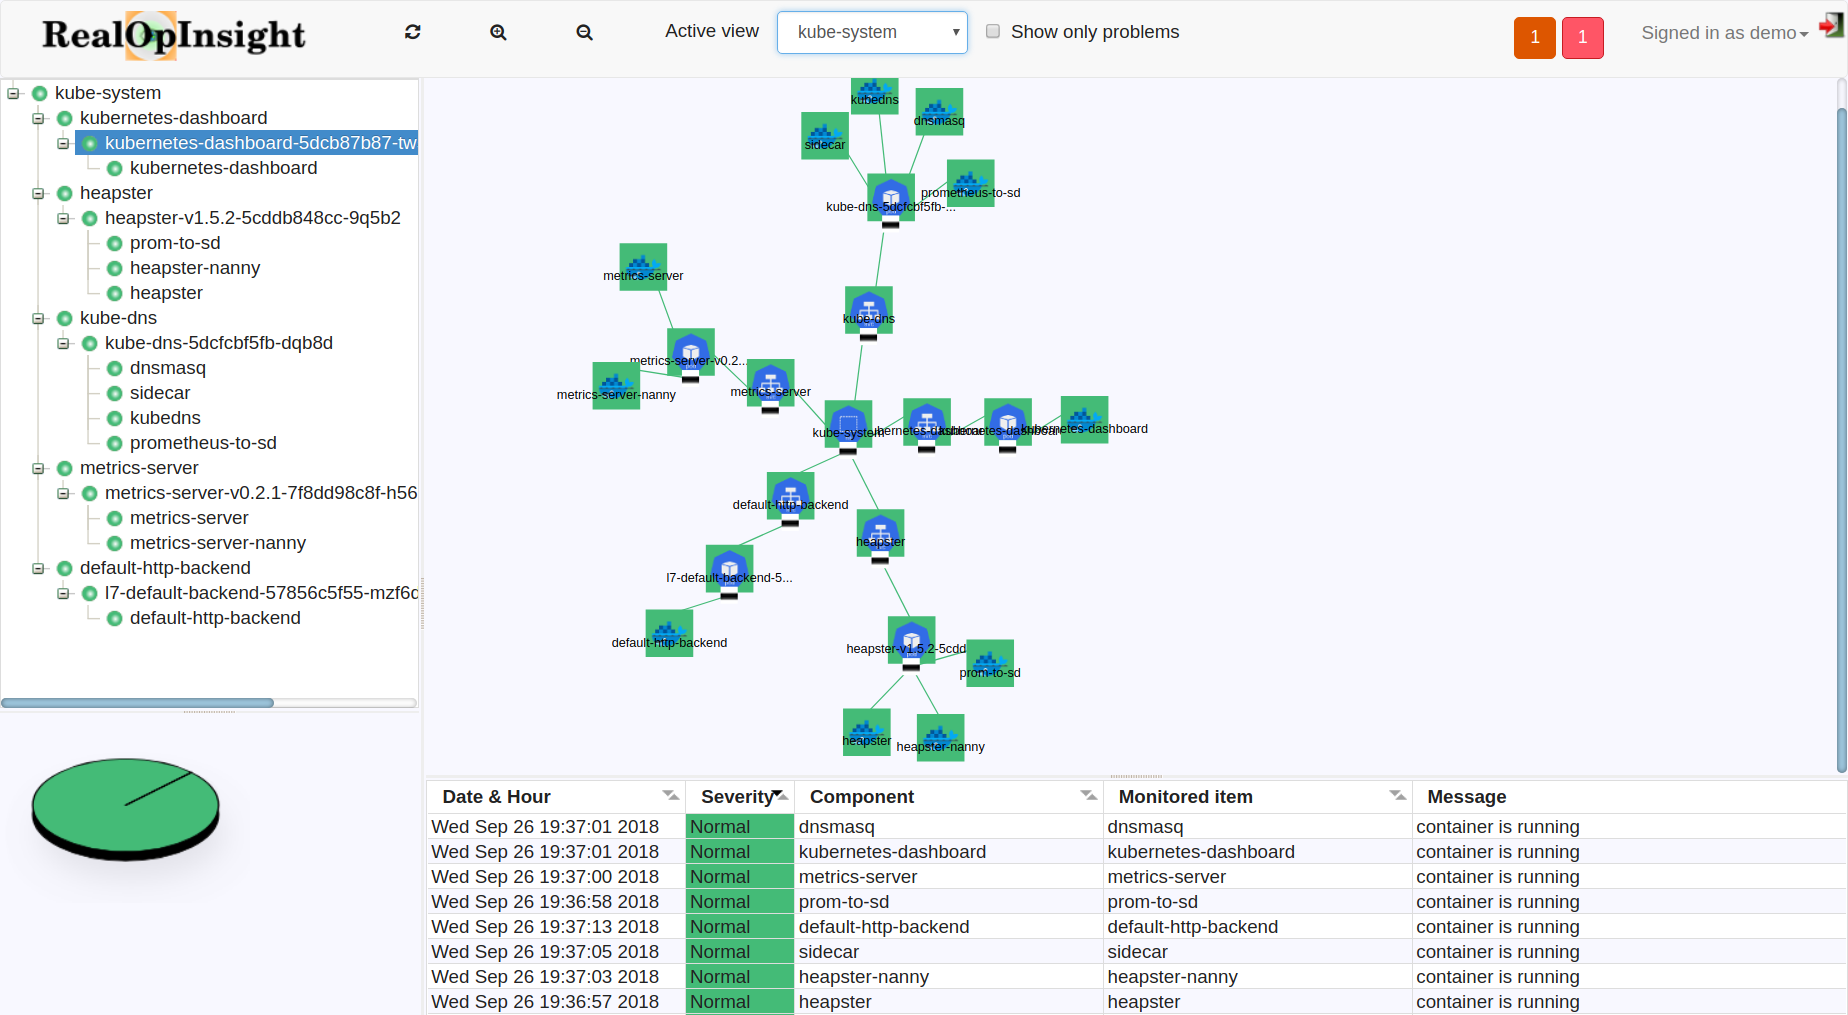
Applyto display the Application Dashboard. - Click on the button
 to refresh the views (service map, service tree, message panel).
In our example there is no problem on pods. If that was the case, you should have seen a related message in the message console, as well as the tree view and the map updated to identify and highlight the impact of the problems on services.
Executive Dashboard
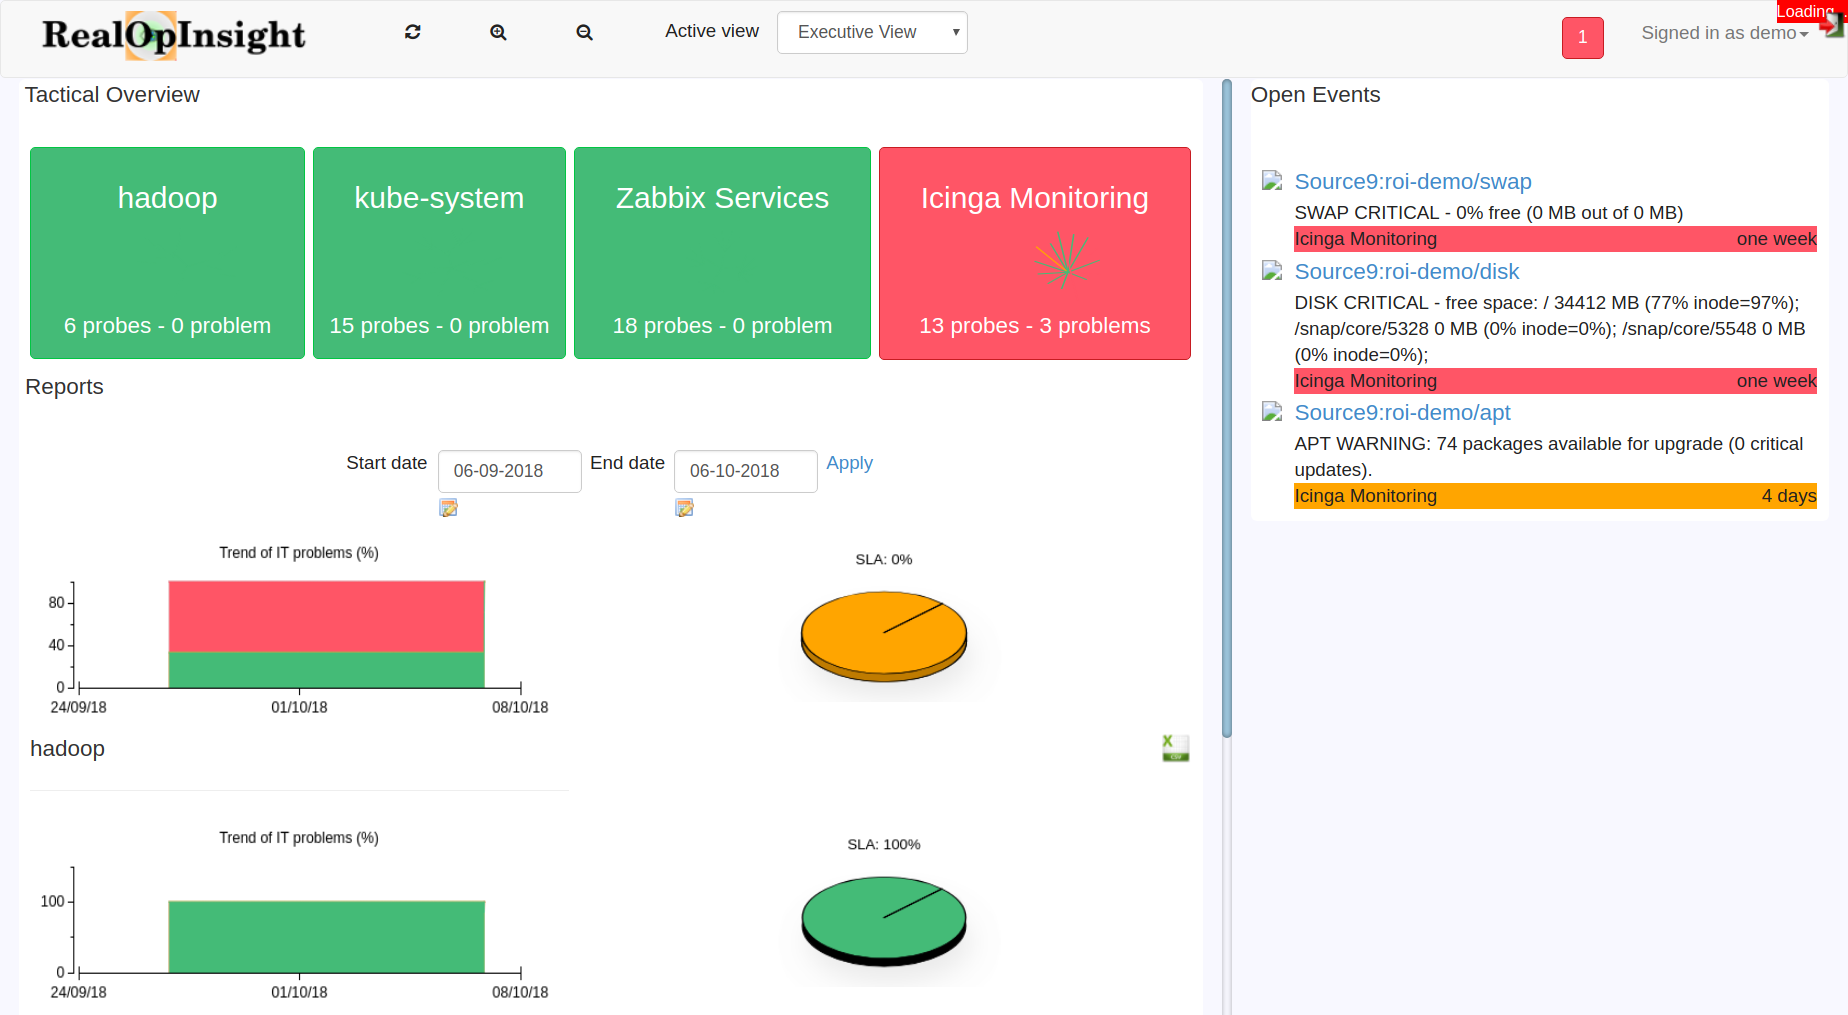
As illustrated on the figure hereafter, the Executive Dashboard can consist of no, one, or many namespace items. It’s organized like a grid with configurable number of columns. The displayed items should have be explicitely assigned to the logged operator prior to the login. Each item is the grid provides a summary of the status of microsservices within the associated namespace.
The rest of this section will describe how to create Executive Dashboards and use them.
Create a Operator User
- Log into RealOpInsight as administrator.
- Select the menu
New User. - Fill in the user information:
- Password must have at least six (6) characters in two classes (upper/lower cases, digits, special characters, etc.).
- Ensure to select
OperatorasUser Role. - The property
Dashboard Tiles Per Rowallows to set the number of columns for the Executive Dashboard.
- Click on
Submitto save the changes.
Assign Operations Views
- Log into RealOpInsight as administrator.
- Select the menu
Operations Profiles. - Select an operator in the user selection list at left.
- Select one or several items in the list of business applications at the right.
- Cick on
Assignto apply the changes.
Operate Executive Dashboard
- Log in as operator
- On login the operator Executive Dashboard will be displayed with the items assigned to him, as shown on the screenshot below.
- You can select a business application tile to open the associated Application Dashboard.
- When an Application Dashboard is active, you can select
Executive Viewto go back to the Executive Dashboard.
This is the end of this quickstart of RealOpInsight, please follow the below links to move forward with advanced use.
Related Links
- For other installation options please see our complete Installation Guide.
- For integration with other monitoring systems (e.g. ManageEngine OpManager) read our Monitoring Sources Integration Guide.
- If you want to learn more about RealOpInsight basics, it’s here.