Overview
RealOpinsight is an open-source operations monitoring system for Kubernetes®, Nagios®, Zabbix®, ManageEngine OpManager®, Pandora FMS®, Zenoss®, Icinga®, op5®, Centreon®, Shinken®, GroundWork®, and various other monitoring systems. The RealOpinsight benefit is to provide powerful aggregation and visualization for a comprehensive insight on your business applications.
Monitoring of Business Applications
The basics of RealOpInsight is to help to monitor how your business applications are operating at any single point of time. RealOpInsight aims to provide to IT managers and operations staffs, tools to easily analyse the impact of any single issue and also to help on investigating root cause problems.
Service Mapping
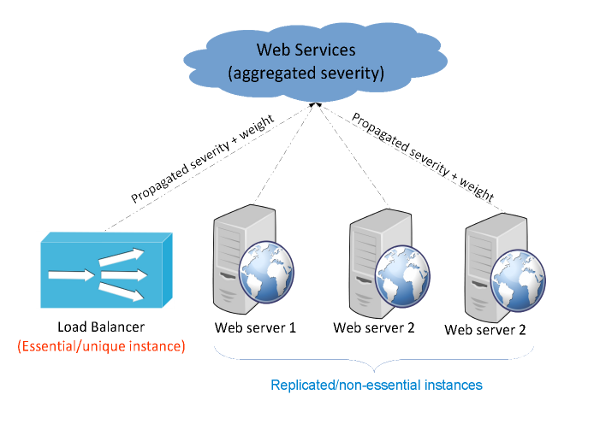
With RealOpInsight, any IT infrastructures is viewed as a set of business applications. Each business application in turn is viewed as a set of components (software, hardware, network…) that rely on each other to provide a expected service (e.g. a Web Services plaform as shown below).

Each service propagates to its parent a severity and a weight associated to the severity. The overall status of the parent service is computed using a calculation algorithm that aggregates the severities and the weights propagated of subservices.
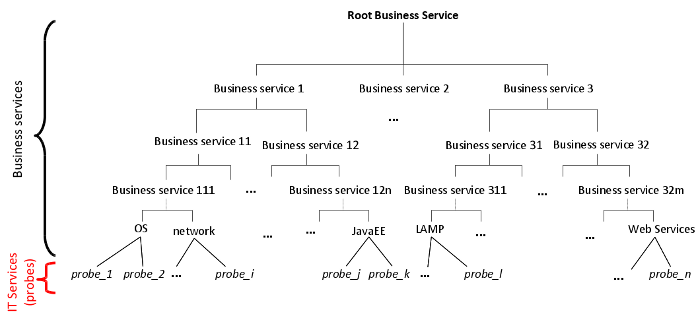
As such a business service can be represented as a dependency graph comprised of the following king of components (see an illustration hereafter):
- IT Services: An IT service defines a service linked to a basic IT capability (e.g. a process). Located at the lowest level of the service hierarchy, every IT service is associated to a monotoring probe. A probe, known as
data pointin RealOpInsight terminology, can be for example a Nagios check, a Zabbix trigger, a Zenoss component, a Pandora FMS module, or whatsoever you want according to the target monitoring system. RealOpInsight periodically retrieves the statuses of IT services from the underlying monitoring systems in order to update a business application dependency graph. - Business Services: A business service may be an application, or any high-level service providing value-added to end-users or to other applications (e.g. operating systems, network, storage, Web applications, database services, downloading service, etc.). Within a RealOpInsight service hierarchy, a business service may depend on one or more subservices, which can be IT services, other business services, or both.

Unified Monitoring
RealOpInsight leverages the capabilities of traditionnal monitoring systems in a unified, and integrated framework so as to make operations management more effective in modern cloud-native environments. RealOpInsight is designed to make its integration easy in distributed and large monitoring environments. It works on top of Kubernetes, Nagios, Zenoss, Zabbix, Pandora FMS, Icinga, Shinken, Centreon, GroundWork, op5, and various other monitoring systems.
Application Dashboard
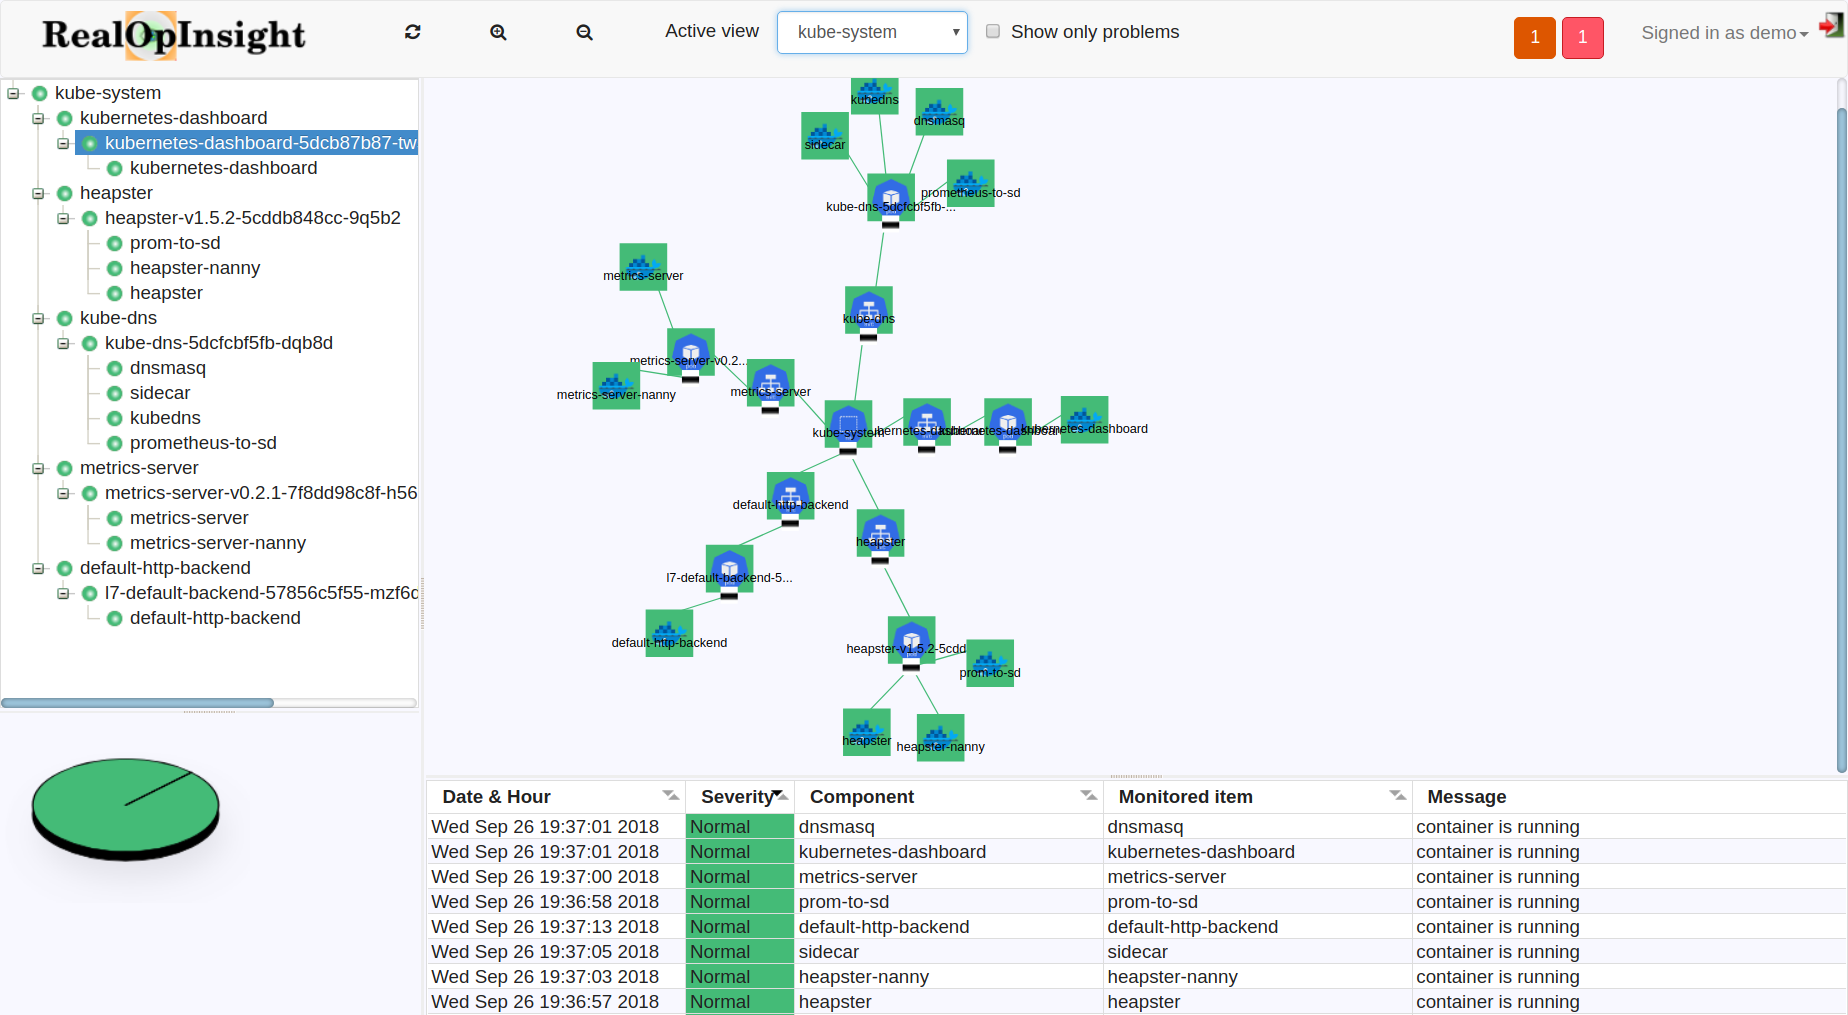
One of key visualization concepts that RealOpInsight introduces is Application Dashboard, as illustrated on the figure below. It provides to administrators and operations staffs a comprehensive view of an application platform through: a Service Tree and a Service Map that represent services along with their dependencies; a Message Panel where status messages related low level services are displayed. In short, an Application Dashboard provides a flexible tool that simplifies incident impact analysis.

Executive Dashboard
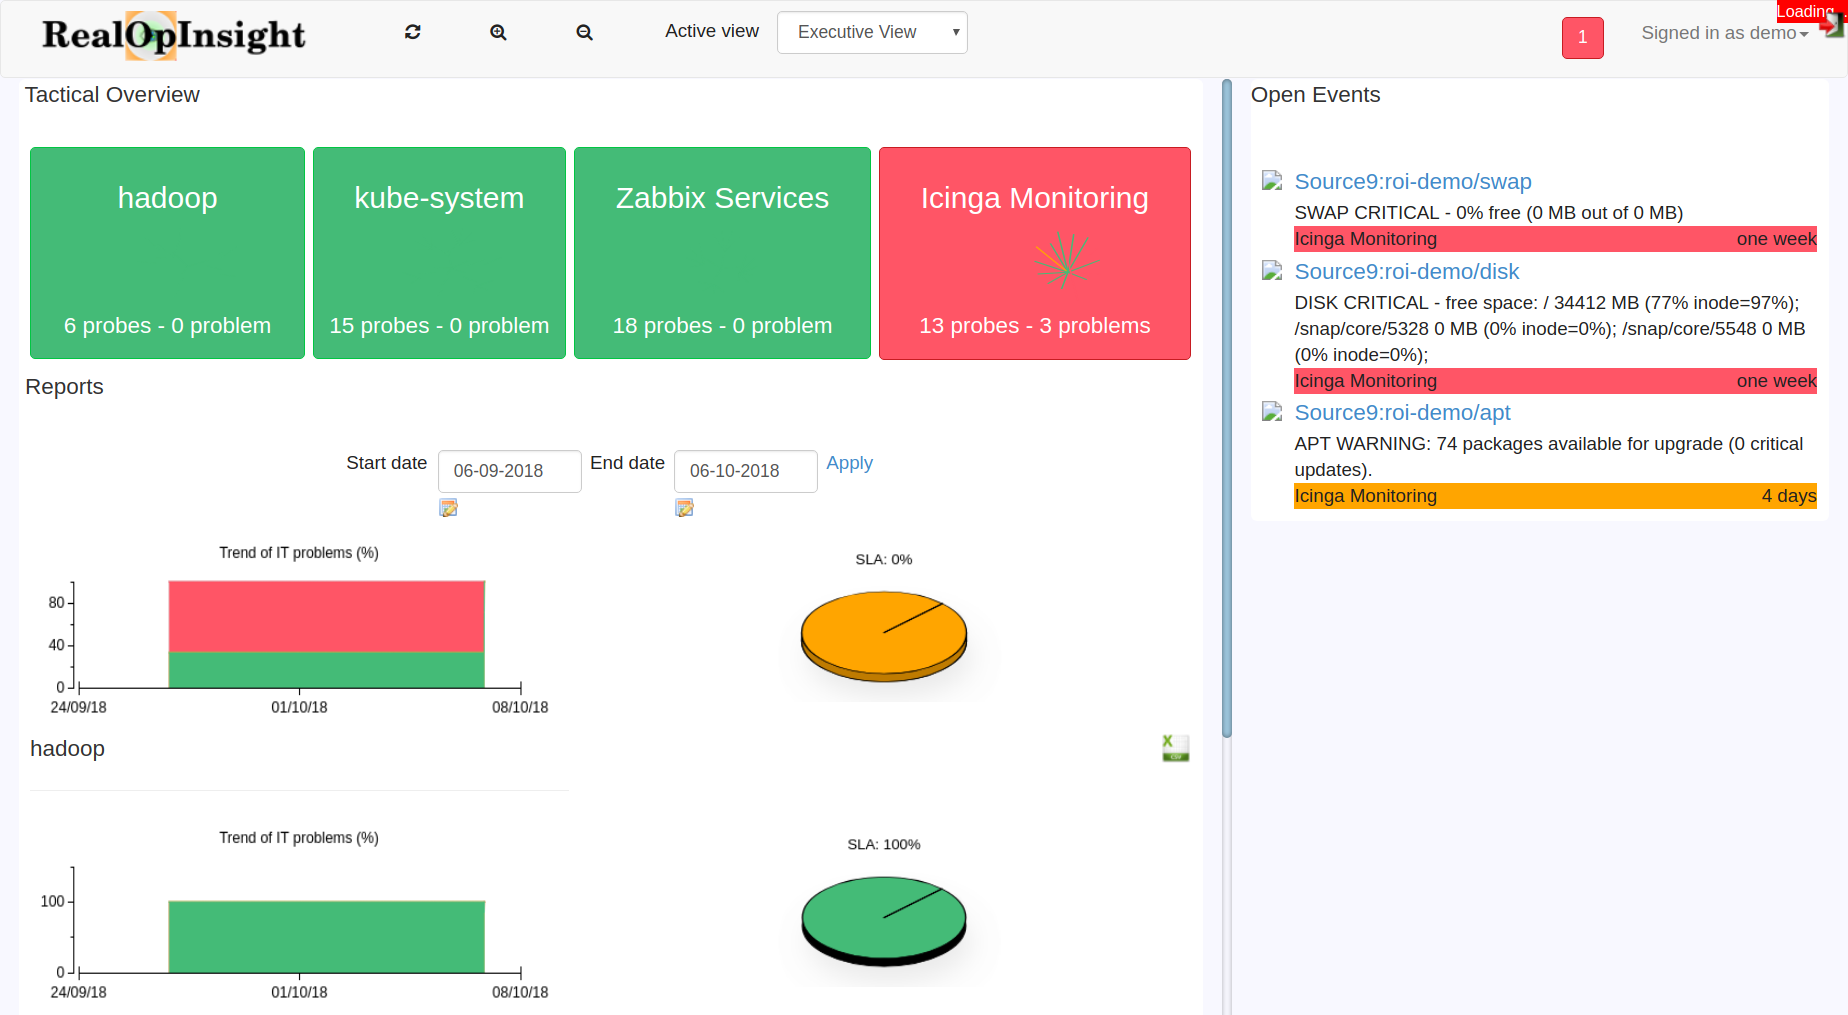
This is another key visualization concept introcued by RealOpInsight. An Executive Dashboard, as you can see an example on the figure below, provides to IT managers and operations staffs a comprehensive status view on a set of business applications. In the Executive Dashboard, each business application is represented by a tile, e.g. Hadoop on the figure, along with a label, a status color, and a summary of problems on the underlying components. The tile is an interactive widget with notably tooltip and a click action allowing to open the associated Application Dashboard.
Each operator has an Executive Dashboard that acts as his home page on login. It can consist of no, one, or many business application items organized within a grid with configurable number of columns. As administrator you need to create operators and explicitly assign business applications to them.

Effective Severity Management
According to the dependency map a service may depend on several subservices. Each subservice in turn may also depend on other subservices, the severity status of a service is determined by aggregating the statuses of its direct lower services. This is done on the basis of specific rules that RealOpInsight provides to aggregate and propagate severity from the lower to the upper services (severity, weight, status propagation rule, status calculation rule).
Weighted Severity
Weighting enables you to associate a weight factor with a service. The
weight factor can be any real number between min=0 and max=10,
determining how important the service is to its parent service compared
to other sibling services.
- A service without an assigned weight factor is assumed to have a weight equal to 1 (default weight).
- A service having a weight factor equal to zero (
min=0) is assumed to be a service that doesn’t have any impact on its parent service (neutral service). Its status is ignored when computing the status of its parent service. - A service having the maximum weight factor (
max=10) is assumed to be an essential service to its parent service. Be an essential service means that if the service is down or unavailable, the parent should not operate properly. Hence its status should be set to down too. E.g: the load balancer is the website architecture presented above <severity_weight_propagation_illustration> is an essential service, since if the load balancer is down, the will be unavailable too. Conversely, the web servers taken individually are not essential since replicated.
In practice, weighting is used in conjunction with severity calculation rules <calcrules> and severity propagation rules <proprules> when computing the overall status of a service according to the individual statuses of its subservices.
Severity Calculation
A calculation rule defines how the severity of a service shall be computed according to the weights and the severities propagated by its direct subservices. RealOpInsight supports the following rules:
- Worst/Most Critical Severity
The status of the service is determined by the highest (most critical) severity propagated by its direct subservices.
- Weighted Severity
The status of the service is determined by the maximum between the weighted average of severities propagated by non-subservices, and the maximum of severities propagated by essential subservices.
Formally speaking, given a service
Shavingnsubservices which respectively propagated the severities s1, s2, …, and sn, along with the weights w1, w2, …, and, wn, respectively. Letmax_essential_severitybe the maximum of severities propagated by essential subservices,nonessential_weighted_average_severitybe the weighted average of severities propagated by non-essential subservices,overall_severitythe overall severity of the serviceScomputed from the weights and the severities propagated by its direct subservices.Generally stated, the weighted average of severities propagated by
nsubservices s1, s2…sn with respectively the weights w1, w2…wn can be determined as following:weighted_average = ROUND ( (w1*s1 + w2*s2 + ... + wn*s2) / (w1 + w2 + ... + wn) )The overall severity of a service can be determined as follows:
overall_severity = MAX (nonessential_weighted_average_severity, max_essential_severity)Concretely, in order to enable the evaluation of these expressions each severity is associated by convention to a positive integer:
Normal=0, Minor=1, Major=2, Critical=3, Unknown=4.
- Weighted Severity with Thresholds
This rule improves the simple weighted average rule described above. In addition, it provides the ability to escalate a severity when given thresholds of similar events are reached. For example, you may want to escalate the severity from Major to Critical if more than 50% of services are in Major state.
When using weighted severity with thresholds, the overall severity of a service is determined by the maximum severity between the weighted average of severities propagated by its direct subservices, and the maximum of severities generated by thresholds. The weighed severity average is computed in the same way as with the classical approach of weighed severity average presented above.
The threshold evaluation is weighted, meaning that if we have a service
Sdepending on two services in the s1 and s2 with respectively the weights w1 and w2. The percentage of subservices ofSin state s1 is given byw1 / (w1 + w2)while the percentage of subservices ofSin state s2 is given byw2 / (w1 + w2).Given that a service can have more than one threshold rules defined, the rules are evaluated beginning by the rule having the highest resulting severity value. For example, if we have the following threshold rules: (R1) 50% Minor => Major, and (R2) 100% Minor => Critical. The rule R2 will be evaluated before the rule R1 since Critical is assumed to be higher than Major. If the evaluation of (R2), i.e. if there are less than 100% Minor events, then (R1) will be evaluated.
Severity Propagation
A propagation rule defines how the status of a service shall be propagated to its parent service. RealOpInsight supports the following rules:
- Decreased
The severity of the service is decreased before being propagated to its parent service.
- Increased
The severity of the service is increased before being propagated to its parent service.
- Unchanged
The severity of the service is propagated as is to its parent service.
In the service dependency hierarchy, the status of a given service is computed by aggregating the propagated severities of its subservices through the severity calculation rule defined for that service.
Homogenized Severity Model
As RealOpInsight deals with incidents coming from various monotoring systems with heterogeneous severity models, it has been designed with a proper severity model. Hence any incidents collected from an external monitoring system enters into RealOpInsight with its status set according to the internal severity model. The severity model is comprised of five levels of impacts (NORMAL, MINOR, MAJOR, CRITICAL, UNKNOWN), associated to the supported monitoring systems as follows:
| RealOpInsight | Nagios State | Zabbix Severity | Zenoss Severity |
|---|---|---|---|
| NORMAL | OK | CLEAR, INFORMATION | CLEAR |
| MINOR | - | WARNING | DEBUG |
| MAJOR | WARNING | AVERAGE | WARNING |
| CRITICAL | CRITICAL | HIGH, DISASTER | ERROR, CRITICAL |
| UNKNOWN | UNKNOWN | NOT CLASSIFIED | - |
Notification Service
RealOpInsight handles notification at business service level, and not at basic incident level like traditionnal monitoring systems. Additional its contextual messages allow you to set specific messages to show on the operations console when a event occurs or is resolved. Indeed, it’s usual that when events occur, your monitoring systems raise generic messages, without any contextual information (e.g. hostname), and often in languages that your operations staffs are not familiar with. To help your operations staffs in such situations, RealOpInsight lets you set the messages to show to operations console when events occur or are resolved. This aims to have better comprehensible and more useful messages.
For example, assume that for monitoring the root partition of a database server, we have the following definition in our Nagios configuration:
define service{
   use                  local-service
   host_name            mysql-server
   service_description  Root Partition
   check_command    check_local_disk!30%!10%!
}
If the free space on that partition becomes less than 30% (warning threshold), then Nagios shall report an alert indicating something like DISK WARNING - free space: / 58483 MB (28% inode=67%).
However, instead of this basis message, RealOpInsight can allow you to have a more human-comprehensible message such as The free space in the root partition of the machine mysql-server is less than 30%*, by setting the following template message in RealOpInsight Editor: The free space in the root partition of the machine {hostname} is less than {threshold}, where {hostname} and {threshold} are contextual tags<contextual_tags> enabled by RealOpInsight. They are automatically replaced at runtime with contextual information. See the complete list of supported contextual tags<contextual_tags>.
