Usage accounting and cost allocation are two of mains operational problems for production Kubernetes clusters. This article, originally published on Medium, introduces Kubernetes Opex Analytics — an open source project (Apache License 2.0) that provides, short-, mid- and long-term CPU and memory resource usage analytics for cost allocation and capacity planning on Kubernetes clusters. The provided analytics are computed per namespace basis with different time aggregation perspectives that cover up to a year. Beyond namespaces, the analytics also highlight part of resource dedicated to the infrastructure (i.e. non-allocatable capacity) as illustrated by the following screenshot.
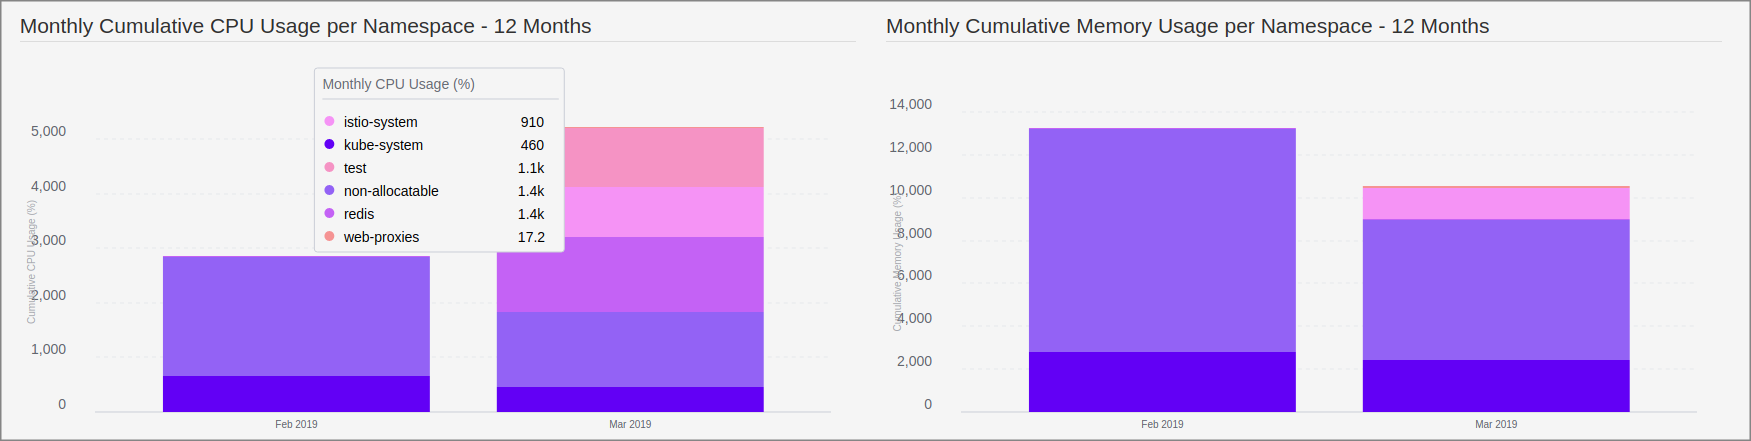 Kubernetes Opex Analytics — A Sample of Monthly Resource Usage per Namespace .
Before the Tool, a Story
A few months ago I decided to give a try to Google Kubernetes Engine (GKE). Going on my way I found that Google offers Free Tier accounts with $300 that you can spend at will for any Google Cloud Platform products you want. I found that really interesting to have sufficient money to try out GKE with no limited capacity as it can be the case elsewhere. Then I asked myself how to make these free $300 more beneficial than start and stop GKE clusters? Okay, I would have learnt GKE things at no cost, but…
But I decided to spend my free $300 in a more productive way, so I started working on Kubernetes Opex Analytics while trying out GKE. Today I’m very happy for my journey through GKE and really proud to contribute back Kubernetes Opex Analytics to the cloud native and Kubernetes communities.
How it Works
Kubernetes Opex Analytics periodically collects CPU and memory usage metrics from Kubernetes’s APIs, stores, processes and consolidates them over time to produce its target analytics.
What Kubernetes APIs
Kubernetes Opex Analytics needs read-only access to the following APIs:
/apis/metrics.k8s.io/v1beta1
/api/v1
Current Analytics
The following analytics are currently implemented, but they are expected to be extended in future versions:
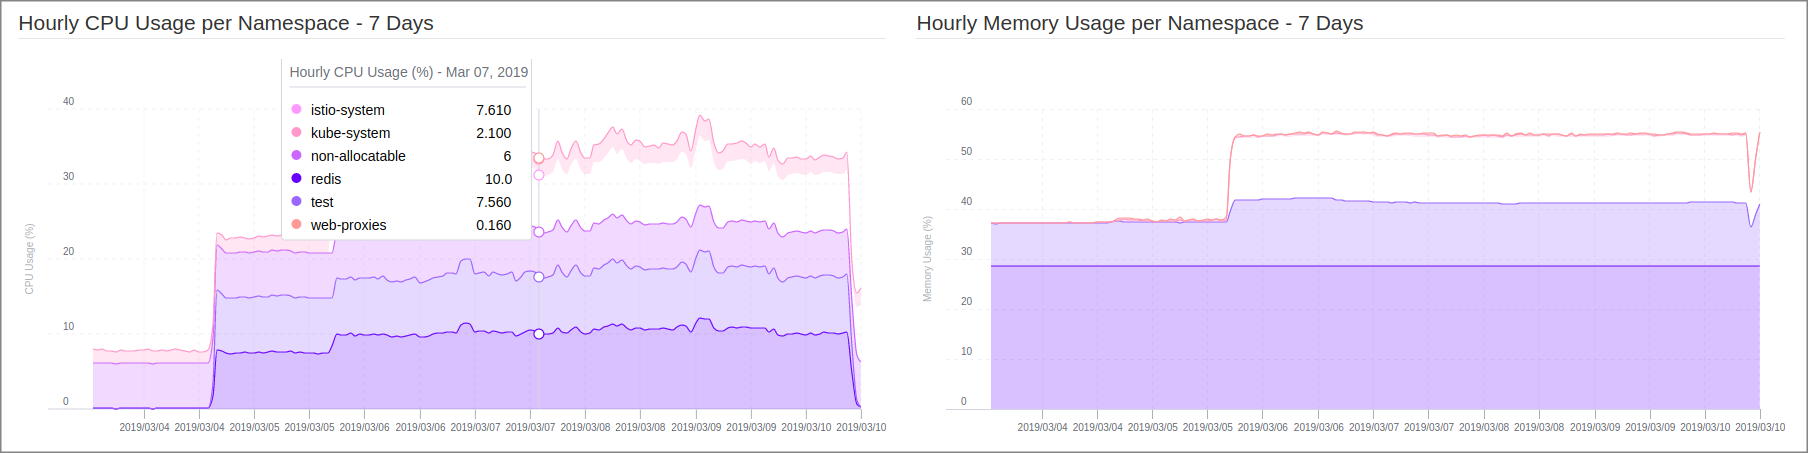
**One-week CPU and Memory Usage Trends **as consolidated hourly usage per namespace and globally for a cluster over the last 7 days.
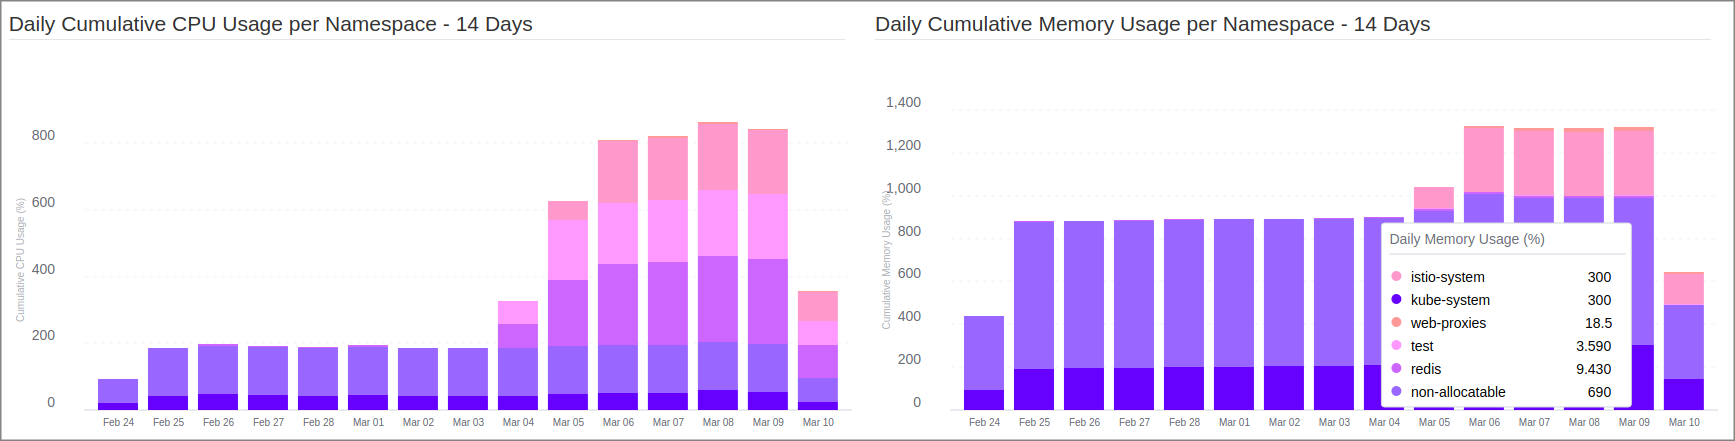
Two-weeks Daily CPU and Memory Usage per namespace as cumulative hourly usage for each namespace during each day of the last 14 ones.
One-year Monthly CPU and Memory Usage per namespace as cumulative daily usage for each namespace during each month of the last 12 ones.
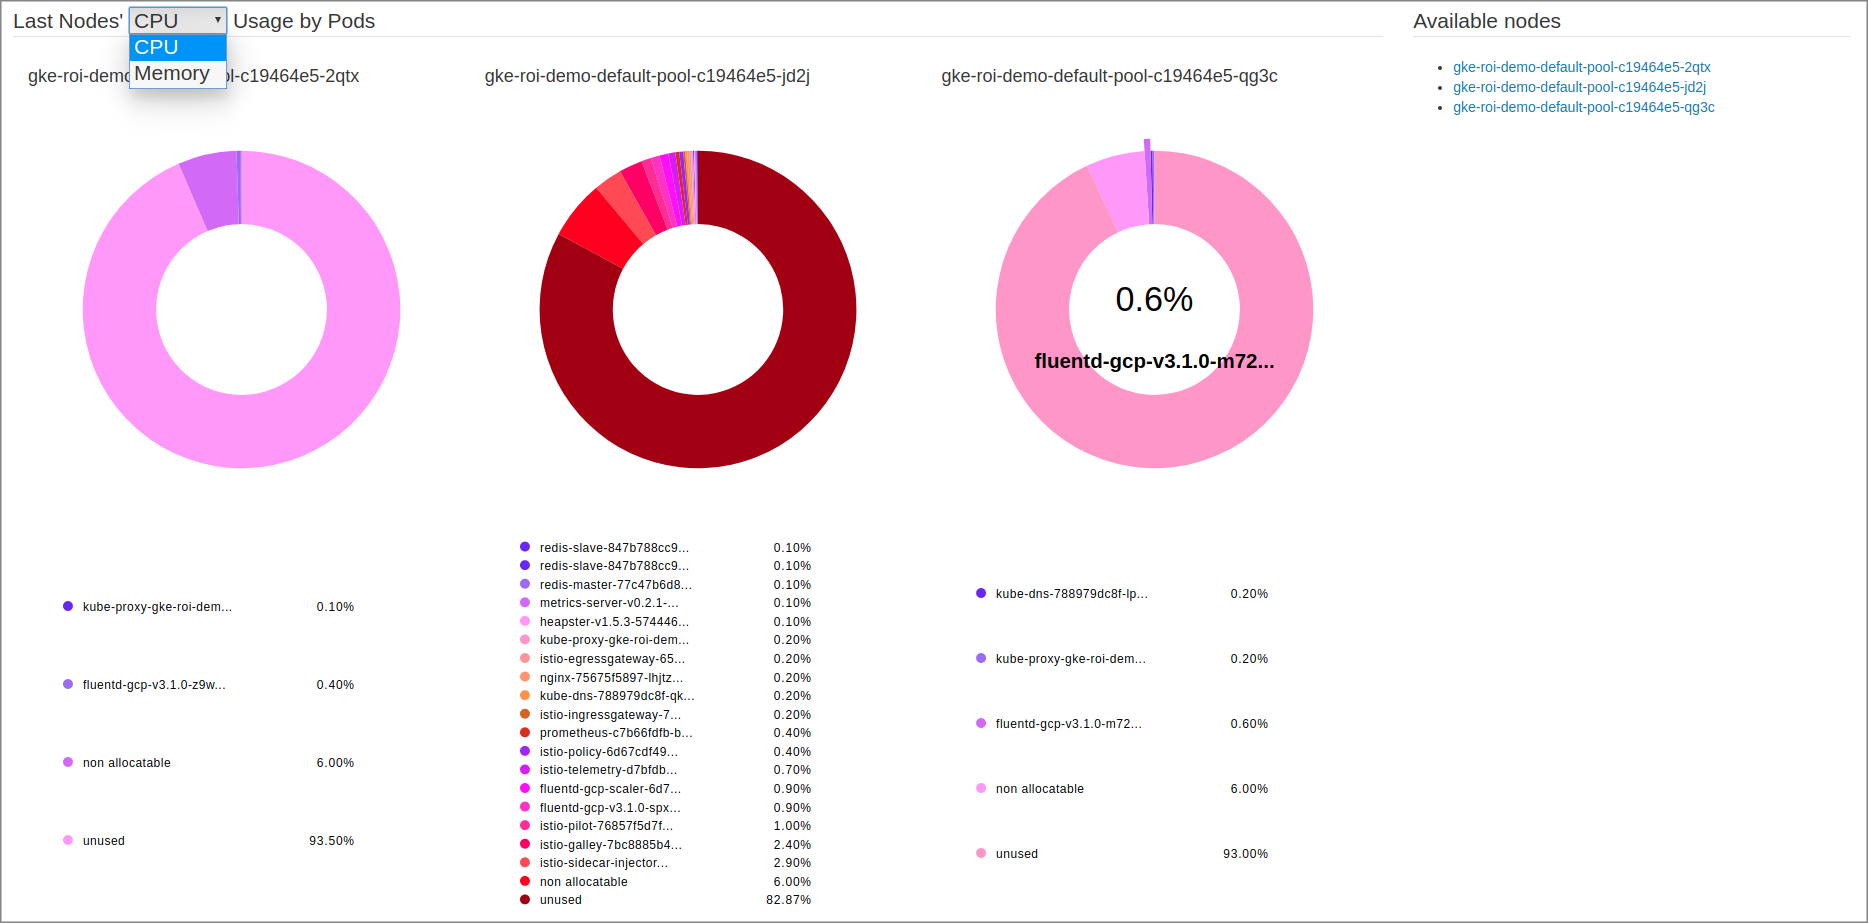
Last Nodes’ Occupation by Pods providing for each node the share of resources used by active pods on the node.
Edit: May 12, 2019. Starting from version 0.2.0, Kubernetes Opex Analytics introduces other cost allocation models. Refer to the README to learn how to configure cost model.
Getting Started
This section will show you how to install and get started with Kubernetes Opex Analytics in less than 5 minutes.
Requirements
We assume that you use a proxied access to Kubernetes APIs as follows:
$ kubetcl proxy
This command will make the proxy access available at http://127.0.0.1:8001 .
Start Kubernetes Opex Analytics
Kubernetes Opex Analytics is released as a Docker image. So you can quickly start an instance as follows:
$ docker run -d \
        --net="host" \
        --name 'kube-opex-analytics' \
        -v /var/lib/kube-opex-analytics:/data \
        -e KOA_DB_LOCATION=/data/db \
        -e KOA_K8S_API_ENDPOINT=http://127.0.0.1:8001 \
        rchakode/kube-opex-analytics
This will make the web access available at http://127.0.0.1:5483/ .
This command provides:
A local path /var/lib/kube-opex-analytics as data volume for the container. That’s where Kubernetes Opex Analytics will store its internal analytics data. You can change the local path to another location, but you MUST take care to adapt the KOA_DB_LOCATION environment variable accordingly.
An environment variable KOA_DB_LOCATION pointing to the path to use by Kubernetes Opex Analytics to store its internal data. You can remark that this directory belongs to the data volume atached to the container.
An environment variable KOA_K8S_API_ENDPOINT setting the address of the Kubernetes API endpoint.
Watch Analytics Charts
Due to the time needed to have sufficient data to consolidate, you may need to wait almost a hour to have all charts filled. This is a normal operations of Kubernetes Opex Analytics.
When everything will be ready you should be able to watch charts as below.
Each chart provides tooltips (mouse hover action) giving details on resource usage for each individual namespace. Furthermore, you can also export each chart as PNG image and its associated dataset in JSON and CSV formats.
Last Week Hourly Resource Usage Trends
Two-weeks Daily CPU and Memory Usage
One-year Monthly CPU and Memory Usage
Last Nodes’ Occupation by Pods
Summary & next steps
I’m very happy to share this open source project with cloud-native and Kubernetes community. I hope that you’ll enjoy it. Kubernetes Opex Analytics is expected to be a fast moving project, so we welcome contributions in any forms (feedback, documentation, code…). Please submit any issues or enhancement requests here. If like this work, consider to clap this story or give a star on Github. You can also fork it, and make a pull request if you wan to share back improvements you made on your side!
Edit — June 30, 2019: Kuberneres Opex Analytics now enables a Prometheus Exporter. Read the related story.