RealOpInsight provides the ability to handle reporting and SLA analysis. This feature is useful for Business Intelligence (BI) graphs and other features that give trends on Quality of Service (QoS) and Service Level Agreement (SLA) over time.
The generated can be exported in CSV format so as to be treated by 3-party CSV-compatible tools (Microsoft Excel and other tools).
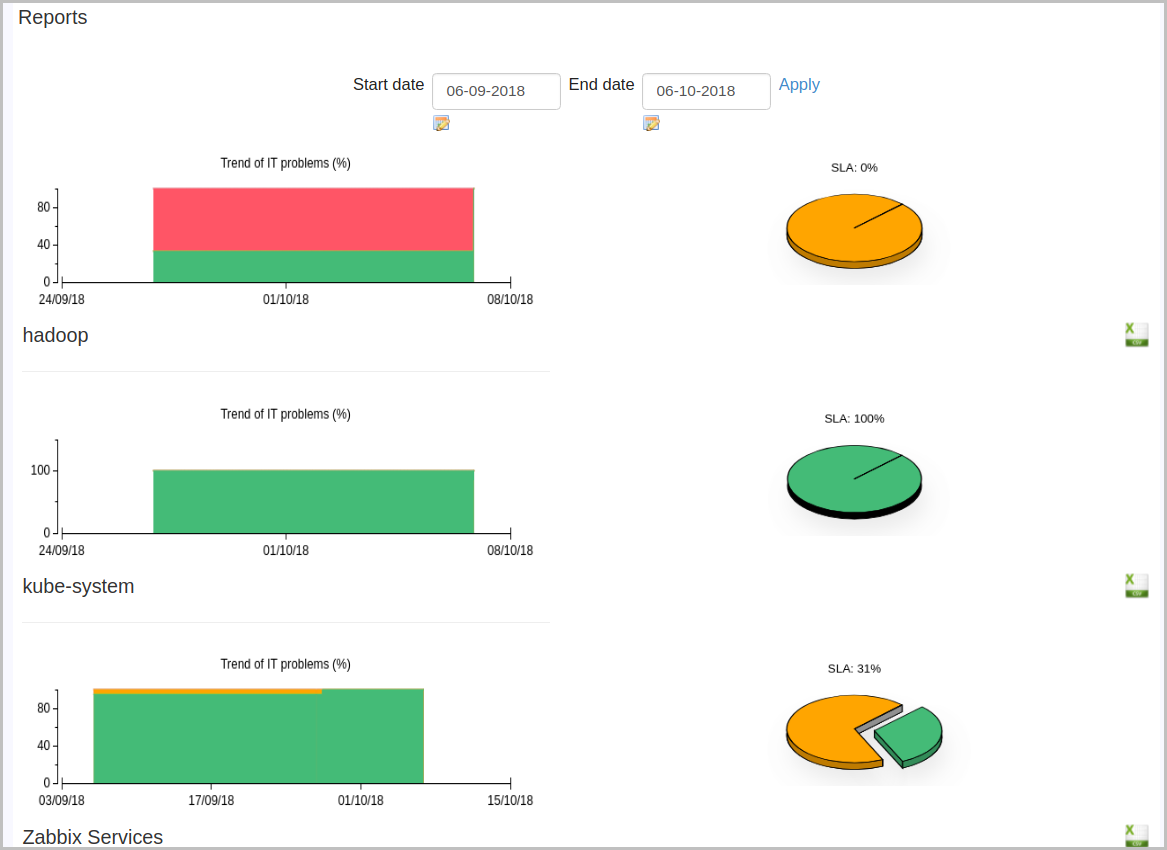
QoS Trend Graphs & SLA Charts
Each operator can access to the reports related to business applications views assigned to him. Displayed reports are by default based on data generated during the last 30 days. As you can see on the following screenshot extracted from our demo platform, you can extend or restrict the period using a date-based filtering.
Export Data
All the generated data can be exported in CSV format so to be processed by external third party tools, (e.g. scripts, Microsoft Excel):
- Select a start and an end date to the exportation interval.
- If you click on
Applythis will update the trend graphs on the selected interval. - Select the icon
 to start the exportation.
 - When prompted, select a destination file to save the exported data.
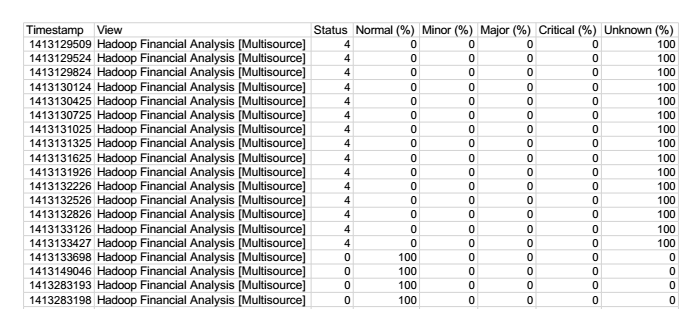
Data Format
As you can see on the screenshot below, each entry of the exported CSV file has the following fields:
- A timestamp in seconds since epoch corresponding to the date of the sample.
- The name of the associated business application.
- The status of the sampling date at that timestamp.
- The percentage of IT services in Normal state.
- The percentage of IT services in Minor state.
- The percentage of IT services in Major state.
- The percentage of IT services in Critical state.
- The percentage of IT services in Unknown state.
Integration with Grafana
Requiring to use PostgreSQL as database backend for RealOpInsight and also to have Grafana 5.3+, you can now visualize SLA & Reporting Data in Grafana. For that we provide a Grafana dashboard script that you just have to copy under the folder public/dashboards/ from the Grafana installation directory, and then create a PostgreSQL Source in Grafana named realopinsight to point to RealOpInsight’s database. The scripted dashboard automatically discovers all the views managed by RealOpInsight.