In this post we’ll show a way to watch Kubernetes services in production thanks to a comprehensive visualization that provides a quick yet effective insight on the heath of your applications. This is a multi-cluster federation and consolidation approach that leverages native containers’ and pods’ health checks from Kubernetes. On top of that, the proposed visualization approach provides an advanced aggregation and simple dashboards allowing to quickly assess how services are operating in each individual namespace.
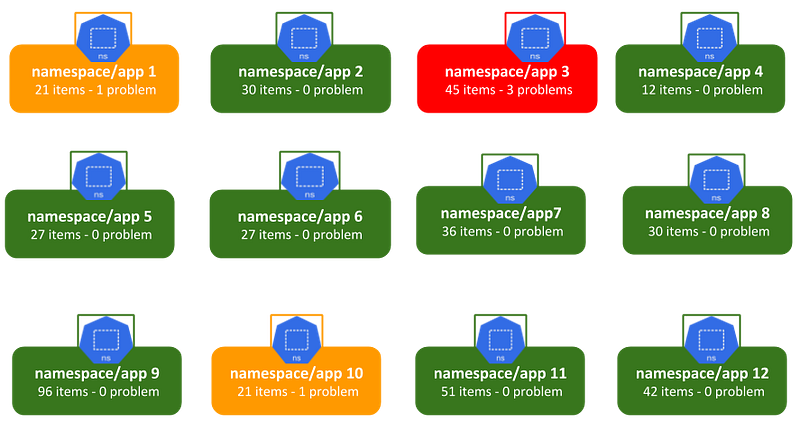 Illustration of the Proposed Namespace Activity Monitoring.
What You’ll Learn
This work intends to introduce concepts and implementation of a visualization approach for Kubernetes that provides:
- Tactical dashboards with a perspective of namespace activity monitoring.
- Easy/quick analysis of root causes in case of problems.
- Comprehensive visualization for proactive monitoring that organizations typically need for T1/T2 helpdesk and NOC monitoring (NOC - Network *Operations Centers).
- Federated multi-cluster and multi-tenant visualization.
- Service level indicators to enable analytics of failures trends over time.
- Email notification when namespaces consolidated activity status changes.
Building Consolidated Namespace Status
As illustrated on the Figure below, the foundation of the approach is that:
- All namespaces are automatically discovered and, for each of them, its components (containers, pods and services) are also automatically discovered to generate a namespace microservice tree that binds the relationship among those components. Basically the discovery of components and the relationship binding within the microservice tree fully rely on pods’ labels and services’ selectors in Kubernetes.
- The logic behind each namespace’s microservice tree is that: at the bottom we have containers bound to their pods, which pods are in turn bound to their services, that are finally bound to the namespace that is expected to represent a virtual application space.
- Within the microservice tree, the status of components are propagated using a bottom up approach. That is designed to always highlight and propagate weird behaviors or situations that can suggest potential failures. For illustration, imagine a service based on replicated pods. If we consider a situation where there is a failed pod, the propagation shall show a problem to highlight the fact that you should consider a potential failure on the underlying pods - even if there are still running pods matching the service’s selectors (see illustration below). Another interesting point is that we’ll be always warned when there is a service whose selectors match no pod.
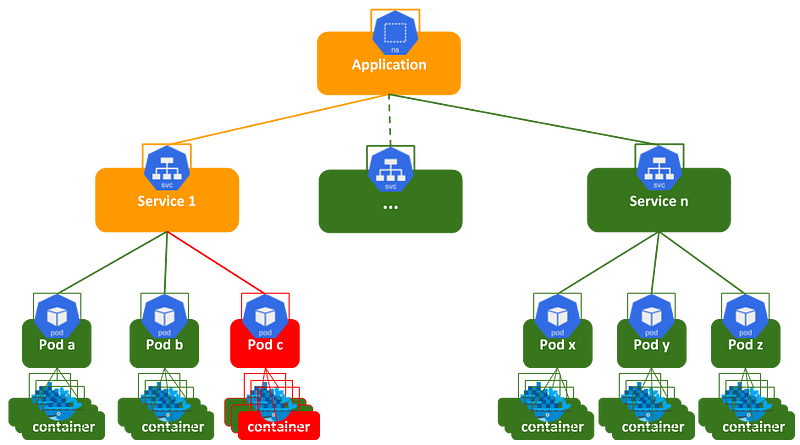 Illustration of Application’s Consolidated Status.
Practice
It’s well admitted, practice is better than speech. In this part we’re going to demonstrate using RealOpInsight how the approach presented above can be implemented on your Kubernetes clusters. In a few steps we’ll see how you can use it in your Kubernetes monitoring environments in a few minutes.
Installing RealOpInsight
RealOpInsight is open source and available on Github. It’s also released as binaries, Docker images, and virtual machine appliances. In the next steps we’ll install it using Docker. For other installation options you can refer to its installation guide.
In the following steps we assume that you’re running a terminal on a machine with Docker installed and ready to use.
You can then start an instance of RealOpInsight with this command:
$ docker run -d \
         --name realopinsight \
         --network host \
         --publish 4583:4583 \
         rchakode/realopinsight
Accessing RealOpInsight GUI
Once the container started (check withdocker ps), you shall be able to access RealOpInsight GUI at http://<docker_server>:4583/ui. Replace <docker_server> by the IP address or the hostname of the Docker machine. Typically if you’re using your local machine the URL should be http://127.0.0.1:4583/ui.
The default credentials to log in are: admin/password. Please consider to change the default password if you’re running a setup opened to other users.
Once logged the administrator home page looks as below; you have menus at the left side and some quick documentation links at the right side.
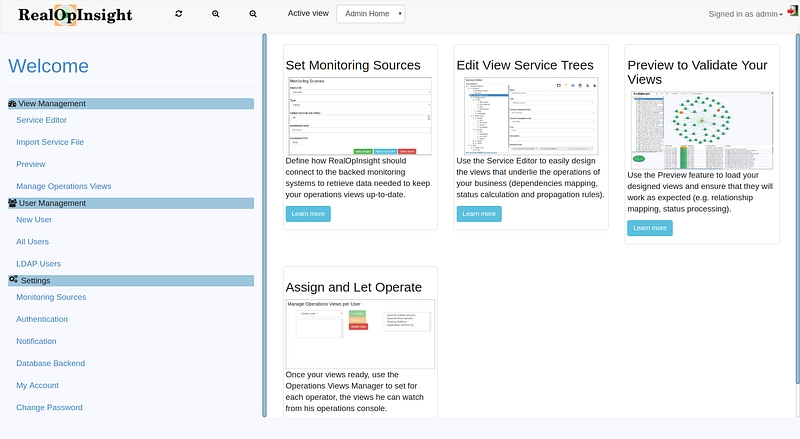 RealOpInsight – Administrator Home Page.
Binding to a Kubernetes Cluster
RealOpInsight requires a read-only access to Kubernetes API and does not directly handle credentials to connect to the API. It can be run inside or outside the target Kubernetes cluster. In this second case it can be bound to Kubernetes API through a proxied access to not require direct credentials.
Running RealOpInsight outside the Kubernetes cluster is notably relevant if you want to bind it to many Kubernetes clusters.
Enabling a Proxied API Access to Kubernetes
In the next steps we assume that you’ve used the following command to enable a local proxied access to the Kubernetes API from the Docker machine.
$ kubectl proxy --port 8001
This will make the Kubernetes API available at http://127.0.0.1:8001/.
Configuring the Binding to Kubernetes API
From the RealOpInsight’s administrator home page, proceed with the following steps:
- Select the menu Monitoring Sources to load the configuration form (see a screenshot below).
- Set the field Source Type to Kubernetes.
- Set the field API Base URL to http://127.0.0.1:8001/. This value assumes that you started a local proxied access to Kubernetes API on port 8001 as described above.
- Leave the other fields as is and select the button Add as source.
- When prompted, set Source Idto Source0
- On success you shall see a message confirming that; otherwise fix errors and apply again.
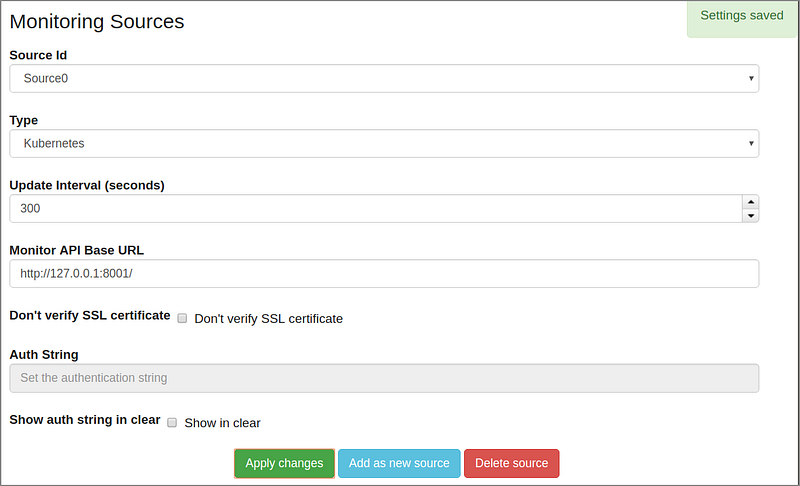 RealOpInsight – Source Configuration Form.
Verify the Kubernetes Source
Select the menu Operations Profiles to check that all the namespaces within Kubernetes have been successfully discovered and imported as on the below screenshot (list at the right side).
Additionally, by using the menu Preview you can see how each namespace’s microservice tree shall look like. But that’s not what we want at the end, so let’s move forward.
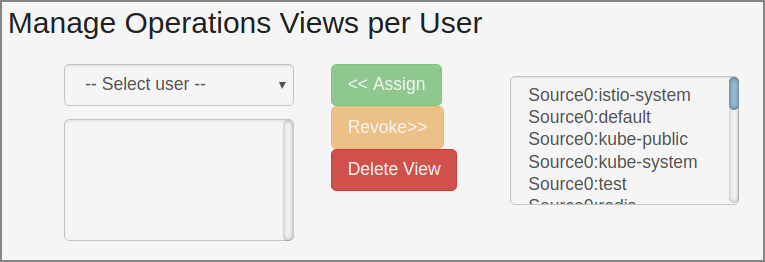 RealOpInsight - List of namespaces automatically discovered and imported from Kubernetes (right side).
Preparing for the Final Visualization
At this step we’re almost ready to visualize our services as expected, but we need to prepare our environment for that:
- Select the menu
New Userand fill in the form to create a new user. Set the required fields and take care to set the user profile asOperator; the password should to be an alpha numeric string with at least 6 characters. For this tutorial we assume that the user created is namedkops. - Then select the menu
Operations Profilesand move to next step. - In the user list at the left side, select the username created previously (
kopsfor this tutorial). - In the namespace list at the right side, select items the user should visualize. You can hold the Ctrl key to select multiple items. Remark that, when you have several users you can assign to each of them a specific set of items for visualization. This capability is typically useful for multi-tenant monitoring environments.
- Click on the button
Assignto validate your choice. - We’re done and can move forward for the visualization.
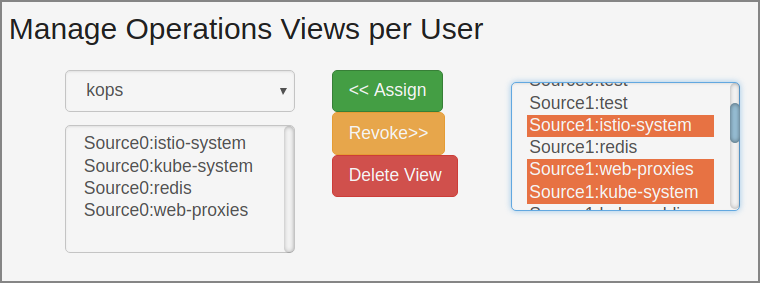 RealOpInsight - Assignment of namespaces for visualization for a user.
Go To Visualization
Log into RealOpInsight as the user you created previously (kops for this tutorial). Upon the login the user’s default dashboard will be loaded and we shall watch a comprehensive view that looks like on the below screenshot. In this dashboard we have:
- A Tactical Overview section at the left side: it provides for each namespace a tile describing the overall status propagated by the underlying microservice tree. By clicking on a tile you will open the microservice tree console providing details on containers, pods and services. This console is further introduced in the next section.
- A Reports section also at the left side: it provides for each namespace a history of pods’ status over a selected period of time (30 last days by default).
- An Open Events section at the right side: it provides a feed of last failures on pods - regardless of the affected namespace.
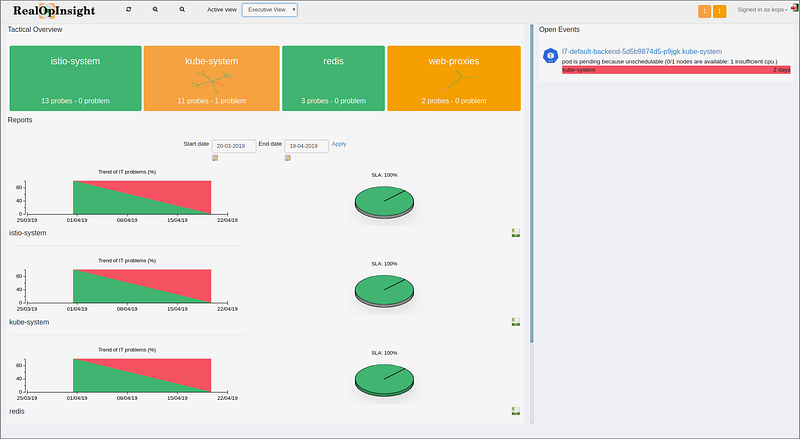 RealOpInsight - Tactical operations dashboard providing overview of namespaces’ status.
Explore Failure Impact and Root Causes
Each namespace’s microservice tree is backed by a console that simplifies the analysis of incident impact and the identification of problems’ root causes.
See the screenshort below for illustration.
Basically the console provides: a Tree View (left side) and a Map (top right side) that display the microservice tree with two exploration perspectives; a Message Panel (bottom right side) to display status messages related to containers and pods. There is also a pie chart (bottom left side) displaying the ratio of pods according to their status - running, failed, pending, etc.
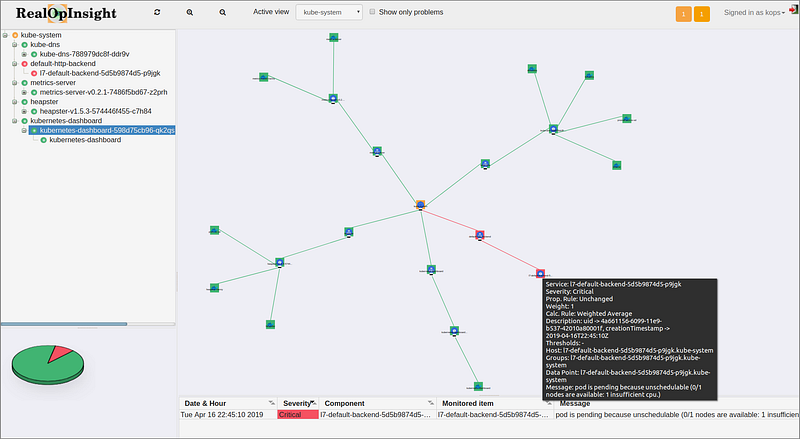 RealOpInsight - Namespace’s console for easy analysis of failure impact and root causes.
Conclusion/Next Steps
In this story, we’ve shown a way to watch Kubernetes services in production environments operated by helpdesk and Network Operations Centers (NOC) teams. We first introduced the basic concepts behind the proposed approach, then demonstrated step-by-step an implementation based on RealOpInsight.
While we’ve mentioned a multi-cluster approach but made the demonstration with only one cluster, it’s worth noting that integrating other Kubernetes sources in RealOpInsight is just simple as what has been described above with one source. If you have multiple Kubernetes clusters, just try to integrate them out and things would just work. You can even set up visualization for your users with namespace items coming from different Kubernetes clusters. Beside that, you can also use the RealOpInsight’s Editor to combine imported items to have a federated visualization item.
Note also that you can configure RealOpInsight to enable email notification when the overall status of namespaces’ microservice tree changes from a normal to a non-normal state - and vice versa. See the menu Notification from the administrator home.
This’s the end of for this post. Enjoy and don’t hesitate to share feedback!
Note: This post has been initially published on Medium.